HIGH and LOW Indicator/Alert


0
0

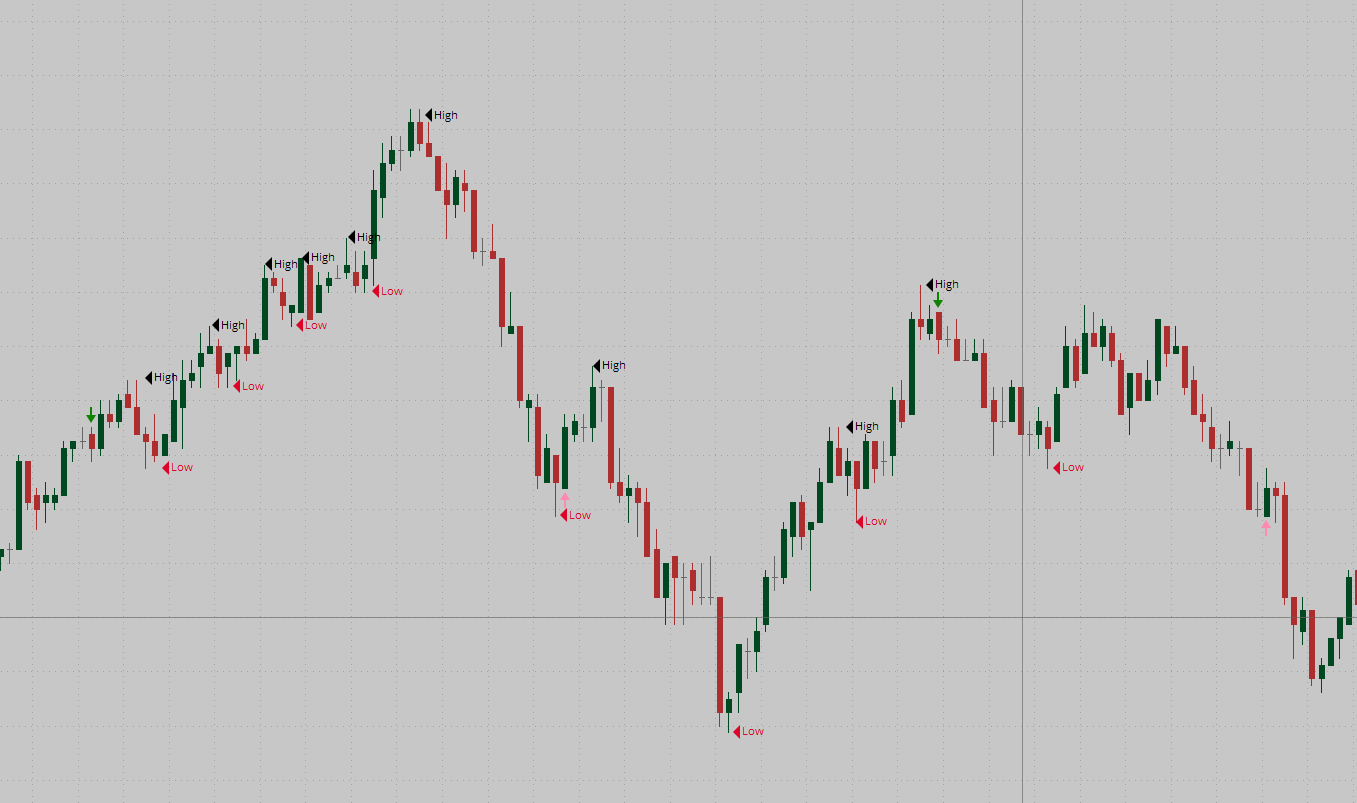
I am looking for a script that can mark all HIGHs and LOWs as per the following definitions. Any help in this regard would be highly appreciated.

HIGH: A new HIGH is established after a previous LOW when a candle closes below its predecessor candles after the most recent LOW.

LOW: A new LOW is established after a previous HIGH when a candle closes above its predecessor candles after the most recent HIGH.

An example is shown in the attached file.

Attachments:
Marked as spam
Posted by (Questions: 2, Answers: 2)
Asked on November 27, 2018 7:23 am
146 views
0

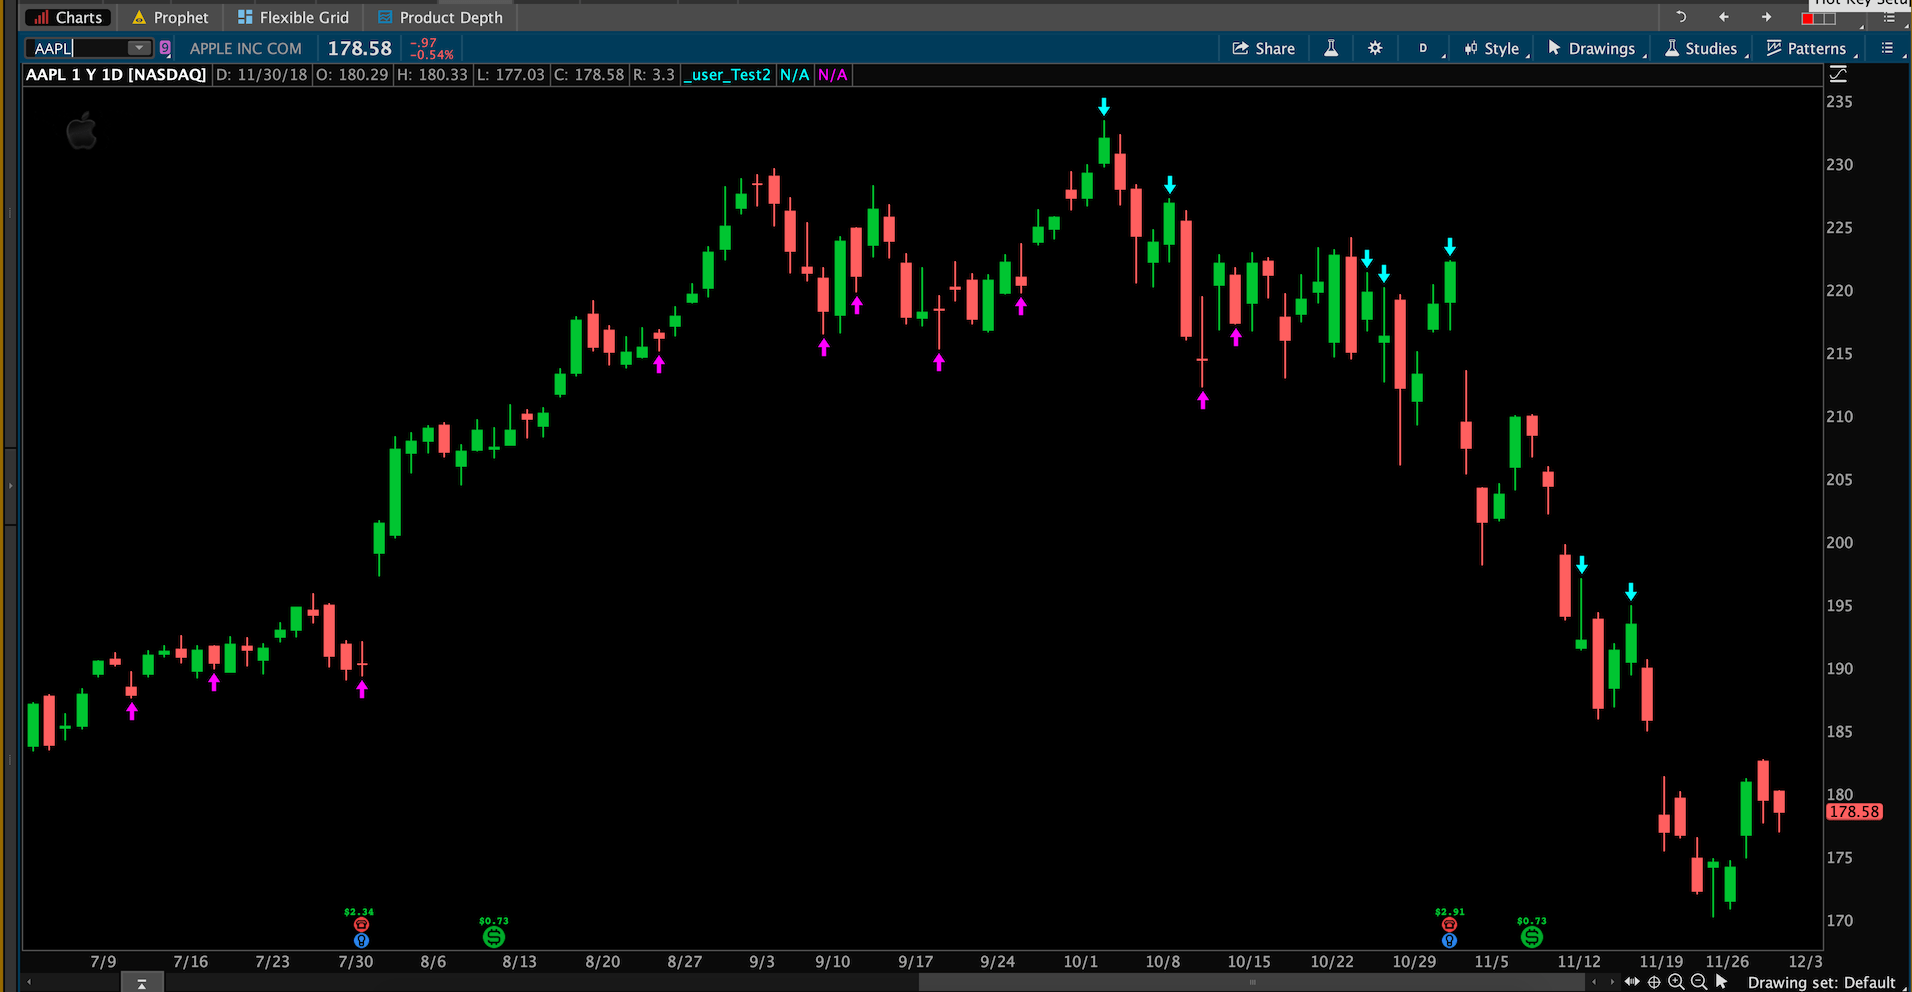
Based on the candles you have marked on the chart, this appears to be a bit more complex than you have described. Your screenshot is lacking ticker symbol, time frame and the date range at the bottom. So even though you provided great detail, it is useless. There is no way for me to replicate that chart on my side when I attempt to write code.

And it is unfortunate that I do not clearly understand the way you are describing this. I have read through your description several times and I have not been able to fully comprehend the set of rules that define these patterns. In particular “closes below its predecessor candles”. I am really lost here. What constitutes “it’s predecessor candles”. When I go to your screenshot it appears you are talking about the first bar to close below the low of any previous candle. But when I check all of the signals you have marked I find exceptions to that.

I’m not sure we can bridge this gap.

( at November 27, 2018 8:32 am)
0
Pete, Thank you very much for your help and I am sorry about the confusion. I have attached a different screenshot with hopefully better markings. The chart is for ES (E-mini S&P 500 Index Futures) 5-minutes on 11/30/2018. The green UP arrow markings (below candles) are LOWs and RED DOWN arrow markings (above candles) are HIGHs. Your interpretation of “closes below” is perfectly correct. Here I am going to try to put the definition again hopefully in clearer way. HIGH: A new HIGH is established after the most recent LOW when a candle/bar closes below the low of any previous candles/bars (after the most recent established LOW). LOW: A new LOW is established after the most recent HIGH when a candle/bar closes above the high of any previous candles/bars (after the most recent established HIGH). Please let me know if this makes better sense. PS: The comment section does not seem to allow attachment. Hence I am going to send the attachment in a separate email.
( at December 1, 2018 12:48 pm)
0
Private answer

Even though we have attempted to clarify things I am certain this is going to miss the mark. It is very common for folks to identify patterns on the chart but not be able to fully describe every last detail involved in the full structure of the pattern.

And the computer needs every last detail. The computer only understands yes and no. There are no grey areas in programming. It either is, or it is not.

def closeBelowPriorLow = close < low[1] and close[1] > open[1];
def closeAbovePriorHigh = close > high[1] and close[1] < open[1];
plot highBar = closeBelowPriorLow[-1];
highBar.SetPaintingStrategy(PaintingStrategy.BOOLEAN_ARROW_DOWN);
highBar.SetDefaultColor(Color.CYAN);
highBar.SetLineWeight(3);
plot lowBar = closeAbovePriorHigh[-1];
lowBar.SetPaintingStrategy(PaintingStrategy.BOOLEAN_ARROW_UP);
lowBar.SetDefaultColor(Color.MAGENTA);
lowBar.SetLineWeight(3);

Screenshot attached shows the result. Notice that on this forum we try to use daily time frame charts because they have the longest self-life and are easiest for our viewers to line up on their platforms.

Attachments:
Marked as spam
Posted by (Questions: 37, Answers: 4108)
Answered on December 2, 2018 9:42 am
0

Pete,
This is not producing the result as I tried to define in my request. One of the thing this script is doing is producing two HIGHs or two LOWs in a row (see 4/18 and 4/26 are two consecutive HIGHs; similarly 4/27, 5/15, 5/31, and 6/11 are indicating 4 consecutive LOWs without having any HIGHs in-between.

A HIGH needs to follow by a LOW and a LOW needs to follow by a HIGH. There can not be more than one LOWs or HIGHs in a row. It needs to alternate between HIGHs and LOWs (e.g., HIGH –> LOW –> HIGH –> LOW –> HIGH –> …. and so on.)

( at December 2, 2018 1:03 pm)
0

Ok, then your pattern is way more complex than something we can address in the free Q&A forum. If this is and important tool for you I suggest you consider submitting this as paid custom project request.

( at December 2, 2018 2:26 pm)