| ♥ 0 |
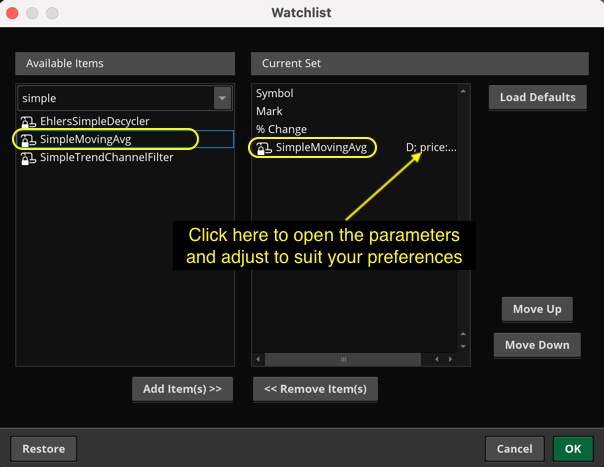
Hello Pete, How are you? in the watchlist section, I added a column to display the simple moving average. I was wondering if it’s possible to modify the SMA to display the 30 Day. Currently it’s displaying some random simple moving average and I cannot find how to modify the length. Thank you
Marked as spam
|
|
Private answer
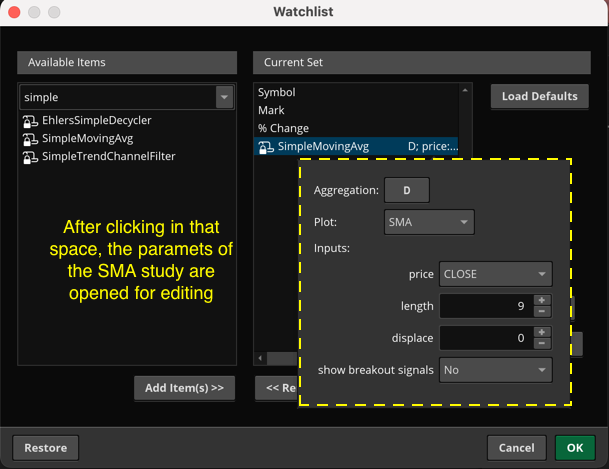
That is a great question and I was surprised that I was not able to find an existing resource published by Thinkorswim which explains how to do this. The solution is very simple, but the method is so subtle that it is easy to miss. Two screenshots below will demonstrate how to access and adjust the parameters. The first one shows that I have added the study named "SimpleMovingAverage" to my watchlist gadget. Want to learn more? What this demonstrates is that we can add a chart study to a watchlist column. The chart study will display values for each of the tickers in the watchlist. The initial parameters are the same exact values as you will find when adding that same chart study to an actual chart. (they are not random, they are the default values assigned in the script) With this in mind you realize there are many built-in chart studies we can add to our watchlists. And when you add a chart study to a watchlist, they will always display that clickable element to adjust the parameters. For example if you add the BollingerBands chart study to a watchlist, the parameters dialog also allows you to select which of the three different plots you want to display in your watchlist. Attachments:
Marked as spam
Answered on July 18, 2024 5:23 pm
|