| ♥ 0 |
Hi Hahn! Thank you very much for your helpful videos. I would like to know if you could generate an indicator similer like the picture Attachments:
Marked as spam
|

|
Private answer
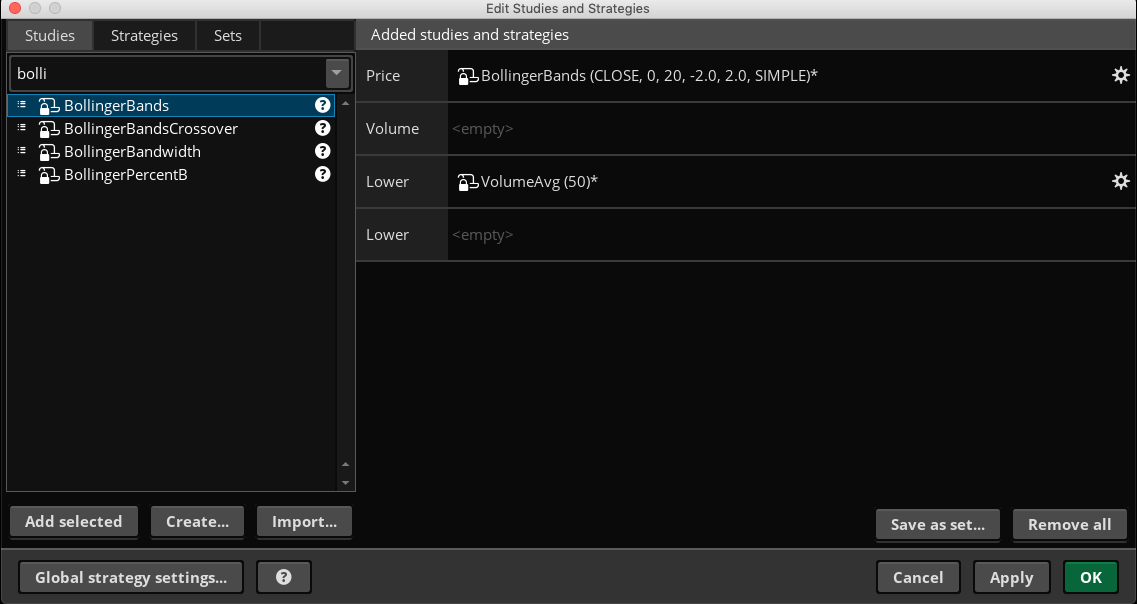
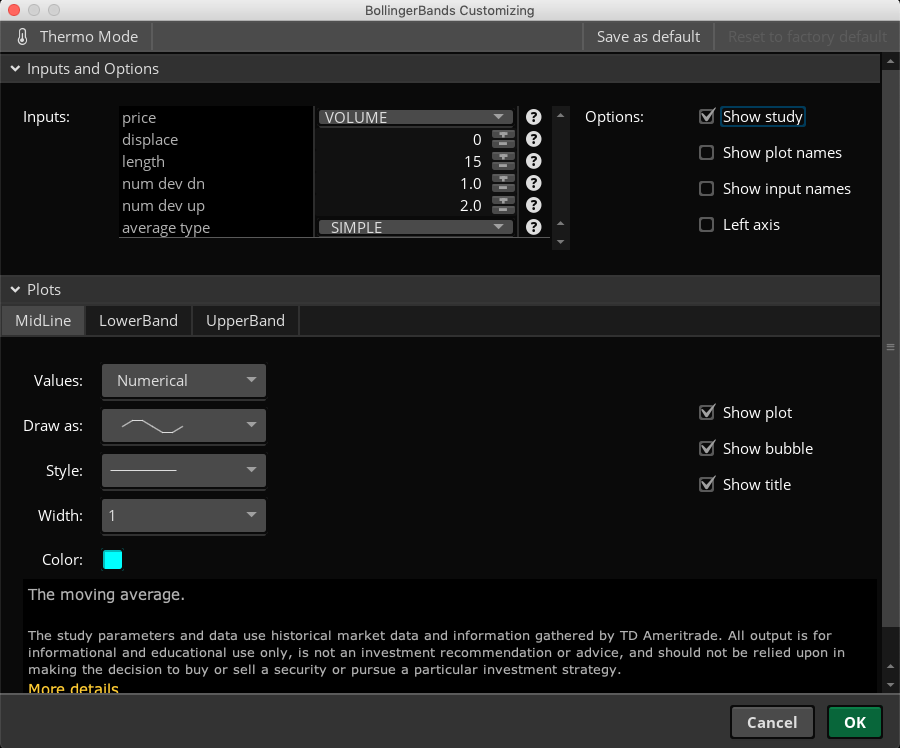
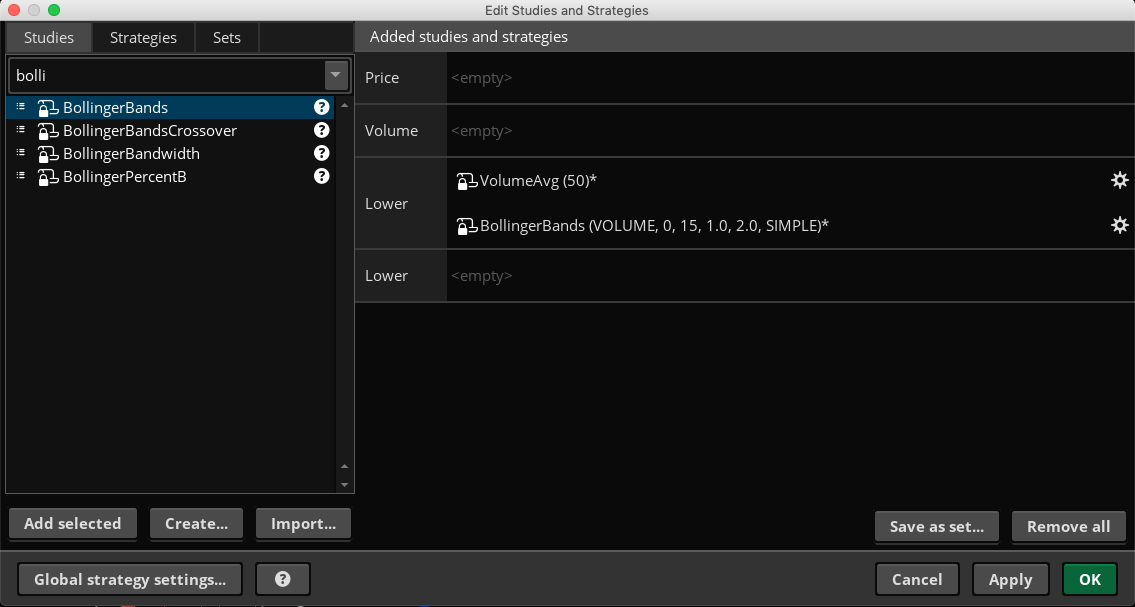
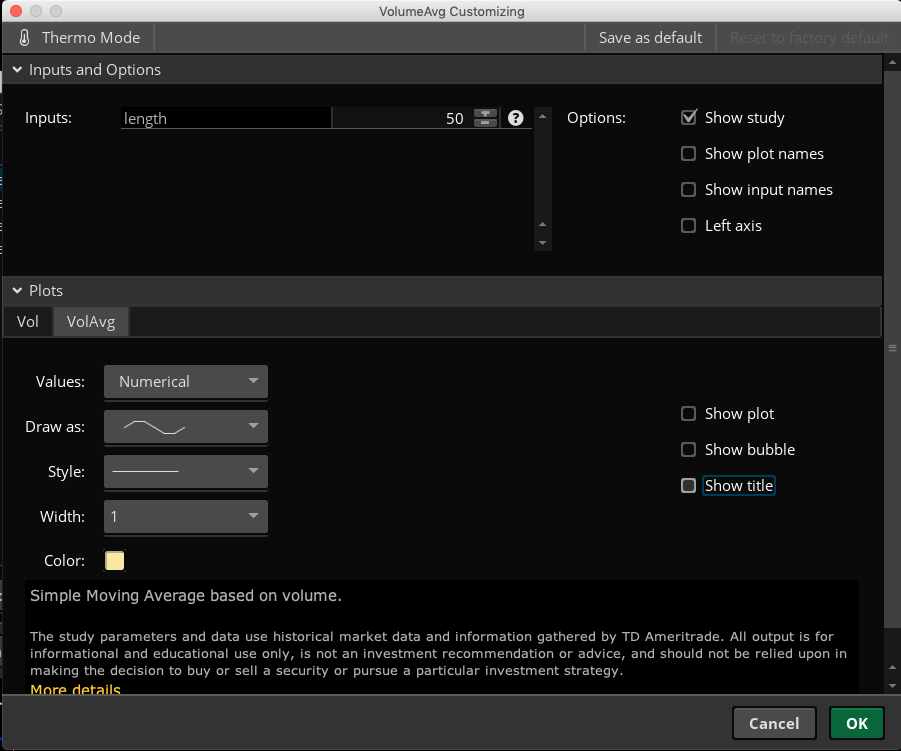
The screenshot provided is very small and does not have enough details to really show your desired result. Not to worry, because the title of your question explains everything we need to know. I also want to mention that the author of this post requested a custom project. They wanted to pay for this solution. However I realized this could very easily be constructed using standard built-in tools that come with Thinkorswim. So instead of charging for the solution I requested they post this in the Q&A forum so we could demonstrate this to the rest of our viewing audience. I receive many requests for custom projects. But when the request really does not require any custom code I try my best to direct these folks to a free solution that has already been published. Or one that I can easily provided in the Q&A forum. The screenshots below show each of the steps. For clarity, I will also describe each of these steps here:
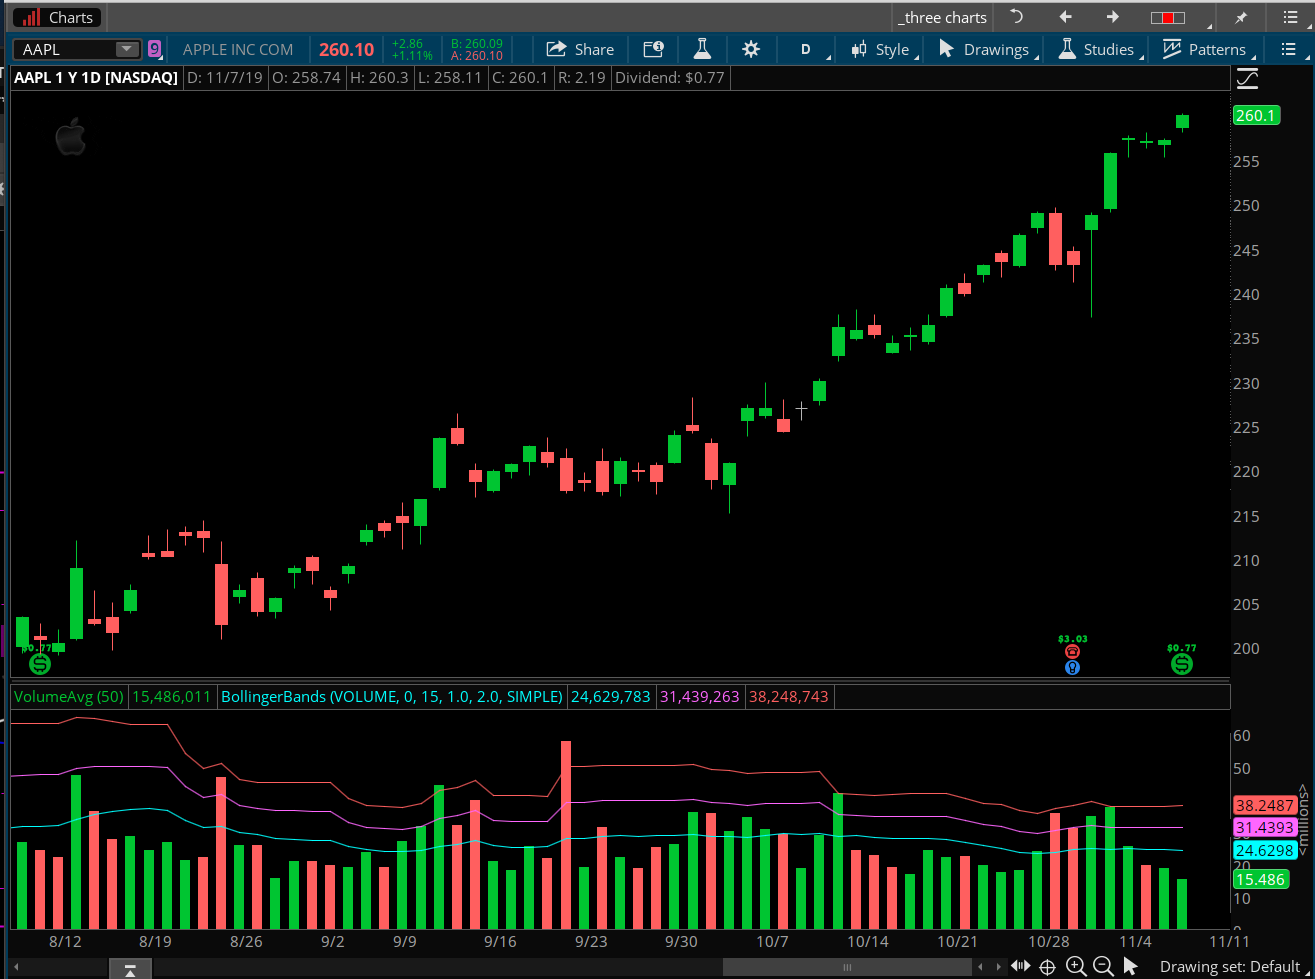
The chart displays the volume on a lower subgraph. The BollingerBands are now being computed from the volume. So when we overlay the BollingerBands over the VolumeAvg we have two studies that now work as a single unit. This is very different than simply overlaying one study against another. The key here is that we first adjusted the BollingBands study to compute its values from the volume data instead of the close. If we miss this step, you really don't have a workable solution. Attachments:
Marked as spam
Answered on November 7, 2019 12:20 pm
|