| ♥ 0 |
Question: # How do I find “x” where “x” is the last value in the array “consecutivehigherhighs”. The idea is to insert it under “totalconsecutivehigherhighs” as it is summation over “x” period where “x” is the last value of the array “consecutivehigherhighs”. rec higherhigh = if high > high[1] then 1 else 0; input Min = 1; plot Scan = totalconsecutivehigherhighs >= Min and totalconsecutivehigherhighs <= Max;
Marked as spam
|
 |
Private answer
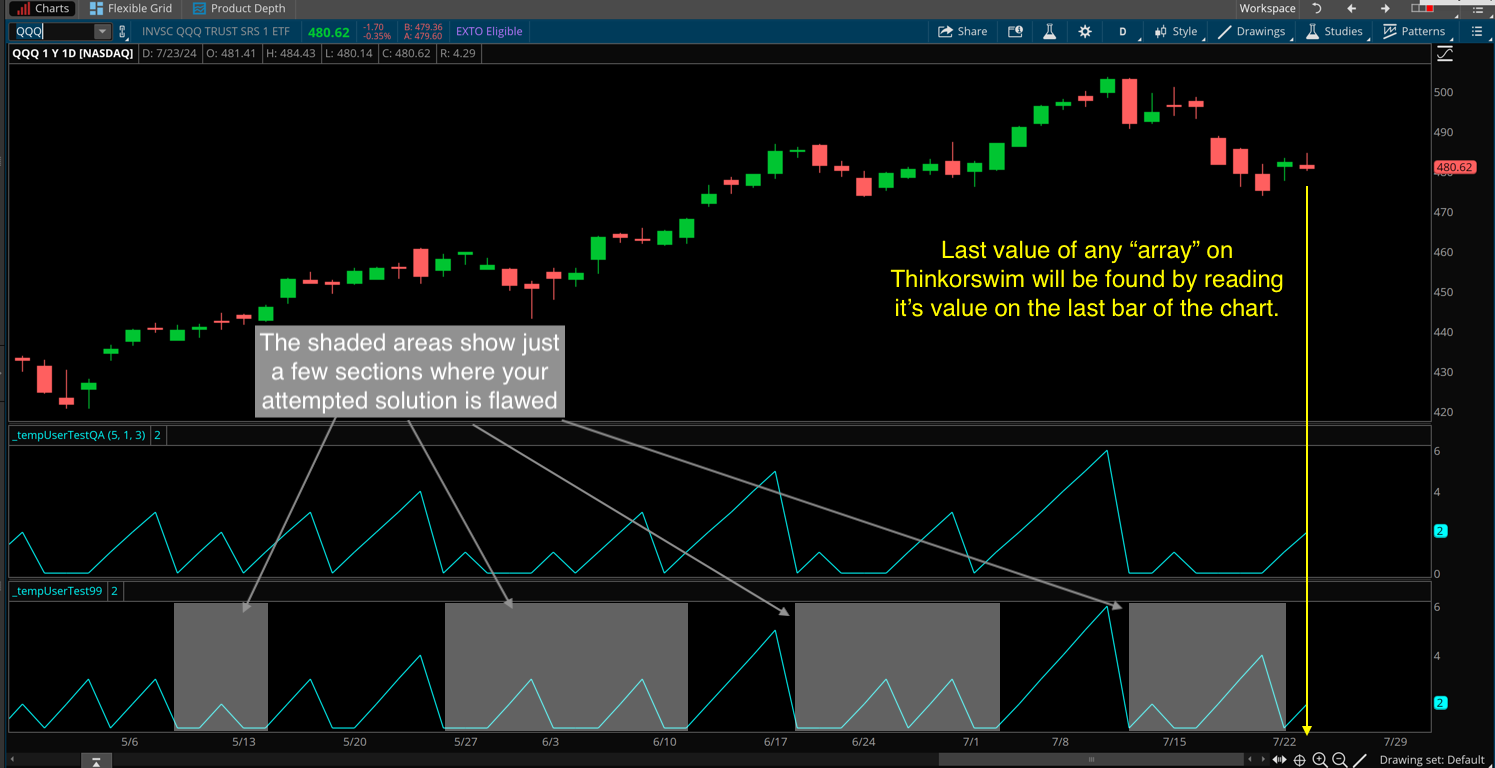
Your question has been removed from the "Frequently Asked Questions" topic and moved to the "Stock Scanners" topic. The FAQ's are not meant for public use. They are only meant for public viewing. Since your code implies you are trying to build a scan, I moved the question to the most appropriate topic. The most direct answer to your question is that you will always find the last value of any array by reading the value of that array on the last bar of the chart. I demonstrate this in the screenshot below. Thinkorswim does not include any tools for working directly with arrays. So there is no way to loop through an array and pick out specific values based on specific conditions or filters. But you have other problems you need to correct long before you get to the goal you are seeking. I will explain... In the screenshot below there are two lower studies. The top one is my version which has been fixed to provide the correct value for the consecutive higher highs. The following code was used to generate what you see on the top lower chart study:
The lower study that appears on the bottom of that chart uses your attempted solution, which is not quite right. I have marked areas of the screenshot to point out the mistakes. The following code was taken from your example to generate what you see on the bottom lower subgraph:
Another very important detail I need to mention is that you will not be able to use a non-static value as the second parameter of the Sum() function. So your entire approached needs to be completely revised. You can read the last value of the array, but you will not be able to use that value as the second parameter of the Sum() function. Attempting to do so will generate an error and prevent the script from compiling. While it may seem that your goals are very simple and easily achieved, the correct solution is actually more complex, and requires an entirely different approach. One that is a bit more complex than I can adequately address as a free solution in our Q&A Forum. But hopefully I was able to show you enough details to get you back on the correct path. Attachments:
Marked as spam
Answered on July 23, 2024 3:03 pm
|