| ♥ 0 |
Hi Pete. Sorry for my last post, hopefully this clears everything up. It would be great if this code can be transferred over to ThinkOrSwim platform. As you can see from the image on the website below, as an overlay you can assign renko brick size on top of a renko chart or a time based chart. This way a trader will only need to look at one screen to see not only price action but clearly see a trend provided by the Renko overlay.
TradingView.com script, and that is it plots Multiple Time Frame Renko bands in an overlay.
If you scroll half way down the page you will see the code. I also attached the code in a text file. https://www.tradingview.com/script/N2WbdfTW-Renko-Price-Bars-Overlay/
Thank you for your dedication and hard work for the community!
Please see attached text file.
Marked as spam
|
 |
Private answer
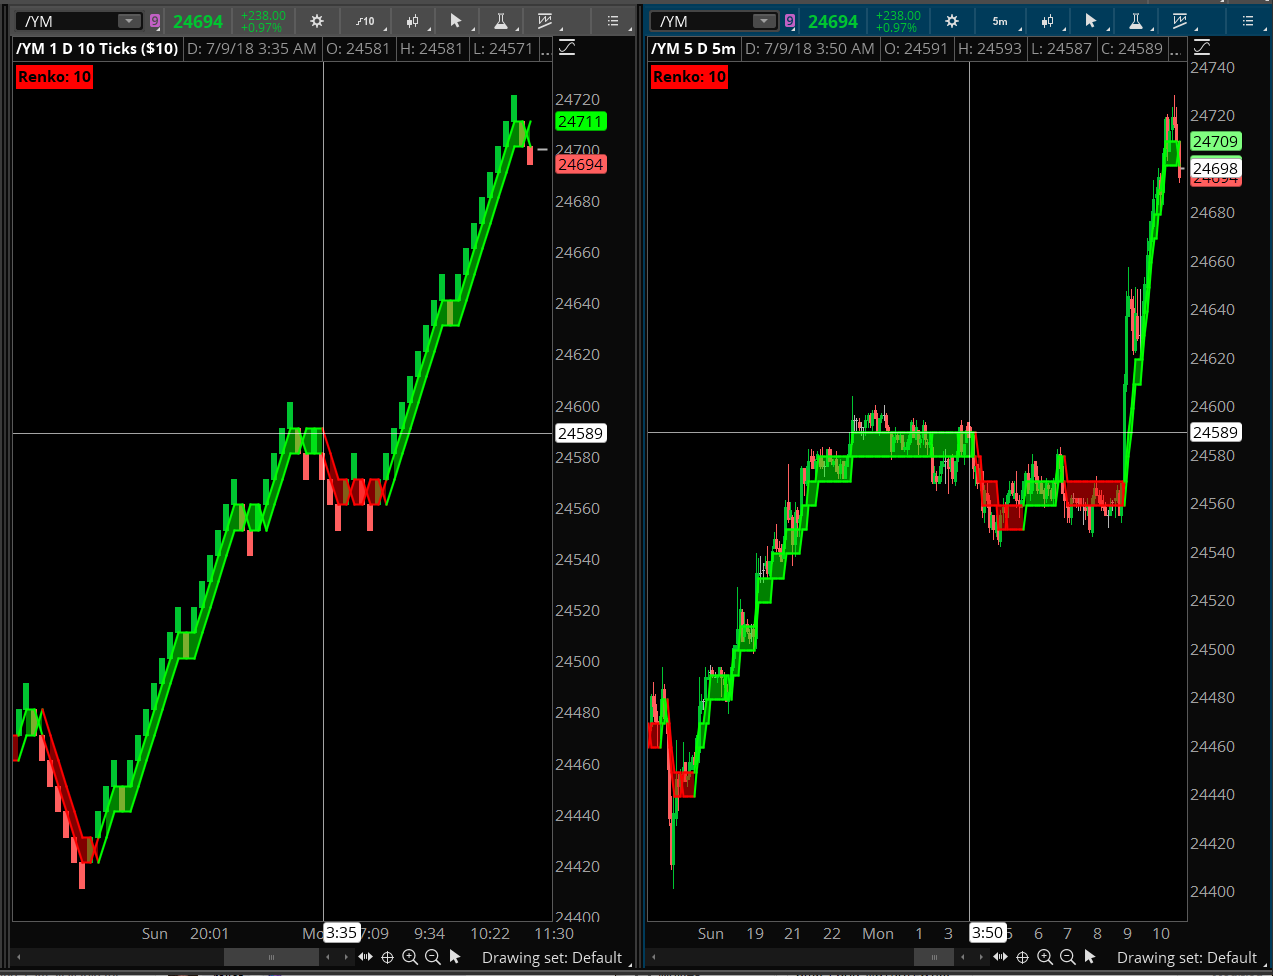
Unfortunately there are some problems with this code. The time frame inputs are not connected to anything. They have no impact on the chart display. So sad to say, this is NOT a MTF version of Renko bars. In fact as I consider this concept it dawns on me that Renko bars could never be applied to multiple time frame. Because it is a range bar study. Formed by ticks on the chart. Complete independent of time. Having said that. I received a very effective version of Renko overlay from one of my clients about a year ago. They received it as a shared item from someone else. Yet they failed to provide the name of the author. So I apologize for not being able to provide credit where credit is due. What’s really nice about this code is how compact it is. Only 40+ lines of code. That one from TradingView is a couple hundred lines. Here is the code as I received it. Screenshot below shows it displayed on two charts. The indicator is set to 10 tick bricks on both. The chart on the right is an actual Renko chart with the overlay. The chart on the right is a 5 min chart with the same exact overlay.
Attachments:
Marked as spam
Answered on July 9, 2018 8:57 am
|
Hi Pete, sorry again, I’m unfamiliar with posting in forums and did not know. I apologize for violating the rules.
As aforementioned, I am unable to get the code to work as in Line 18 s1 and same appear in red
Line 22 showcloud and Line 24 showcloud appear in red.
I would reattach the screenshot I added erroneously in the Post your Answer in the forum. I have anoxic brain injury so it’s possible I’m not seeing the choose file but it’s there? But I don’t see an attach file here in the add comment or I would re attach the screenshot of the error.
Yes I did click apply to activate it. Even before I clicked apply it was showing red. I tried time based charts and tick charts. Nothing came up on any chart.
Again, I know I keep apologizing to you and wasting your time correcting my errors in posting to this forum, but forgive me I’m not entirely all there if you know what I mean and that is why I’m looking for something like this overlay to assist me in trading.
Have a great day!
Thank you!
No worries. Try copying and pasting it again. I made some edits to correct some formatting. Website gets a mind of it’s own once in a while. There were some line breaks that did not get carried over when I copied and pasted out of Thinkorswim. One of the primary reasons I provide STUDY.ts files with my videos instead of text files.