| ♥ 0 |
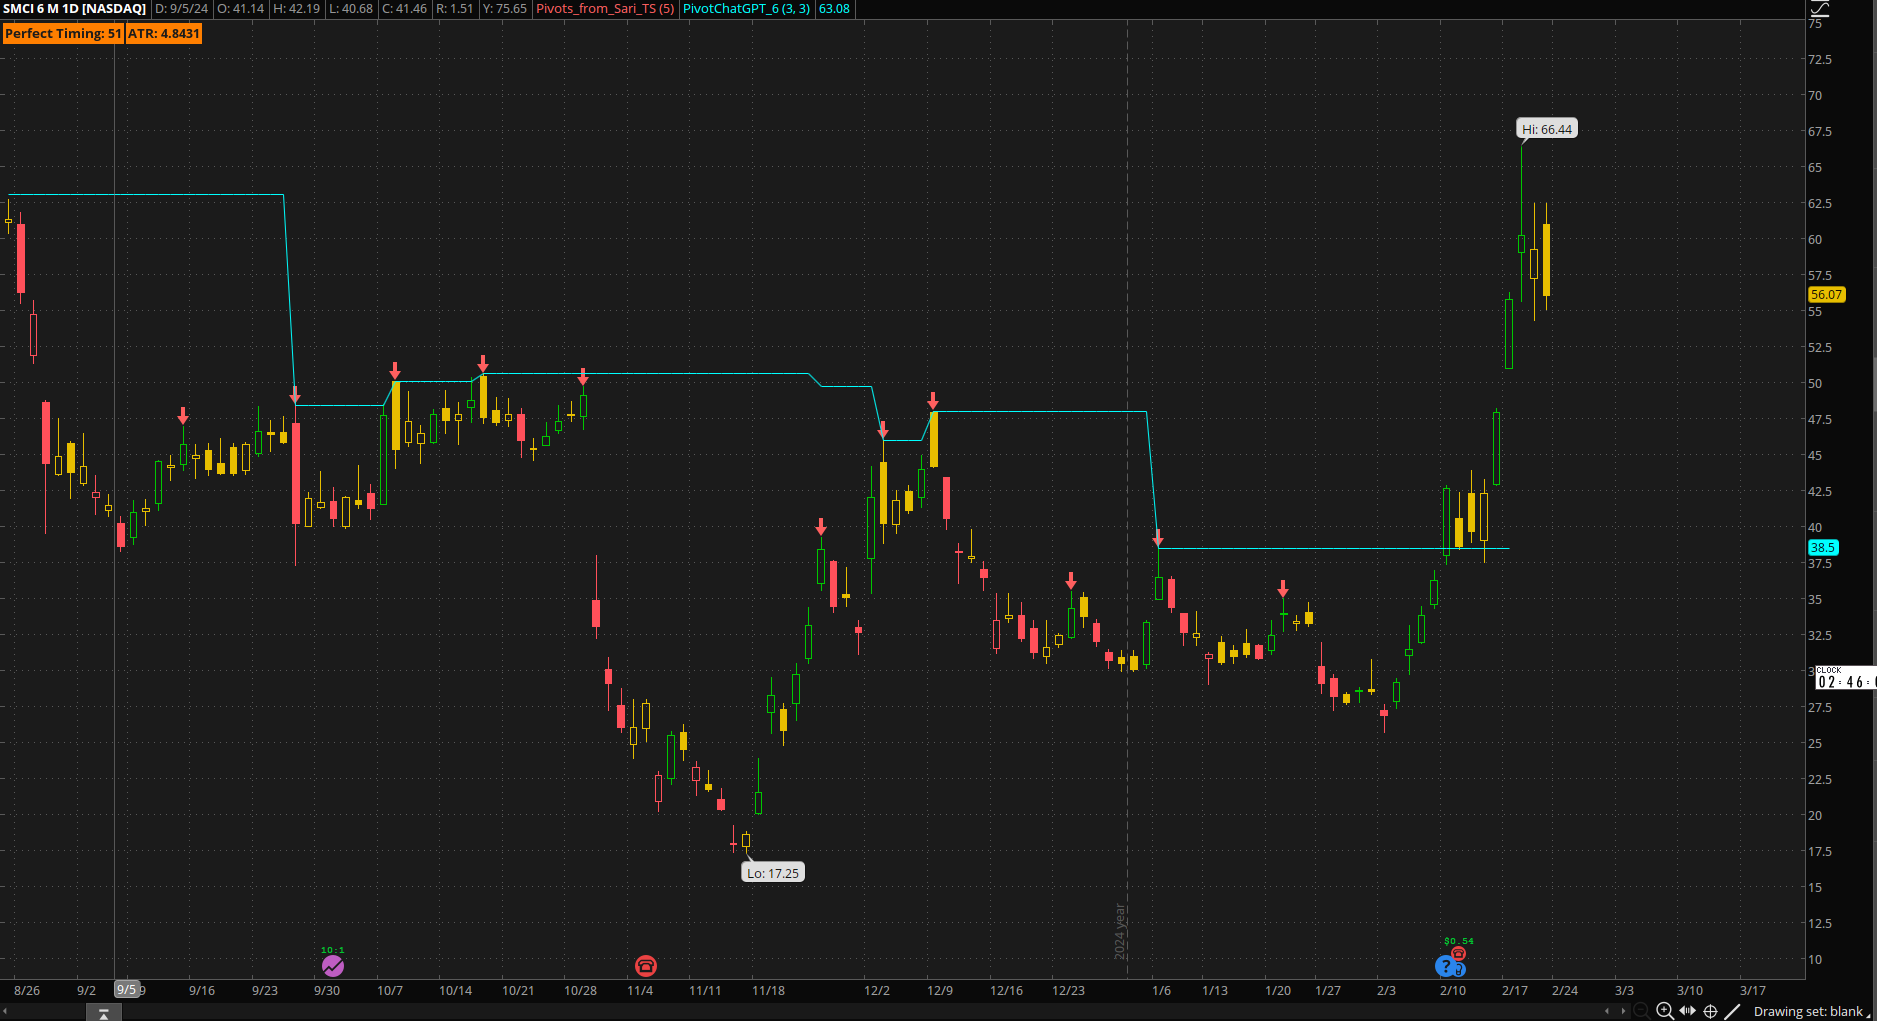
My code plots a line that moves up when the next pivot is higher, but moves down when the next pivot is lower. The plot should remain at the higher value when the next pivot is lower. I tried a Max statement (commented out), but that does not plot anything. The code: input Left = 3; # Number of bars to the left of the pivot def isPivotHigh = high > Highest(high[1], Left) and high >= Highest(high[-Right], Right); def pivotHigh = if isPivotHigh then high else Double.NaN; rec lastPivotHigh1 = if !IsNaN(pivotHigh) then pivotHigh else lastPivotHigh1[1]; #plot PivotHigh1 = Max(lastPivotHigh1, lastPivotHigh2); plot PivotHigh1 = lastPivotHigh1; PivotHigh1.SetDefaultColor(Color.RED); Attachments:
RESOLVED
Marked as spam
|
|
Private answer
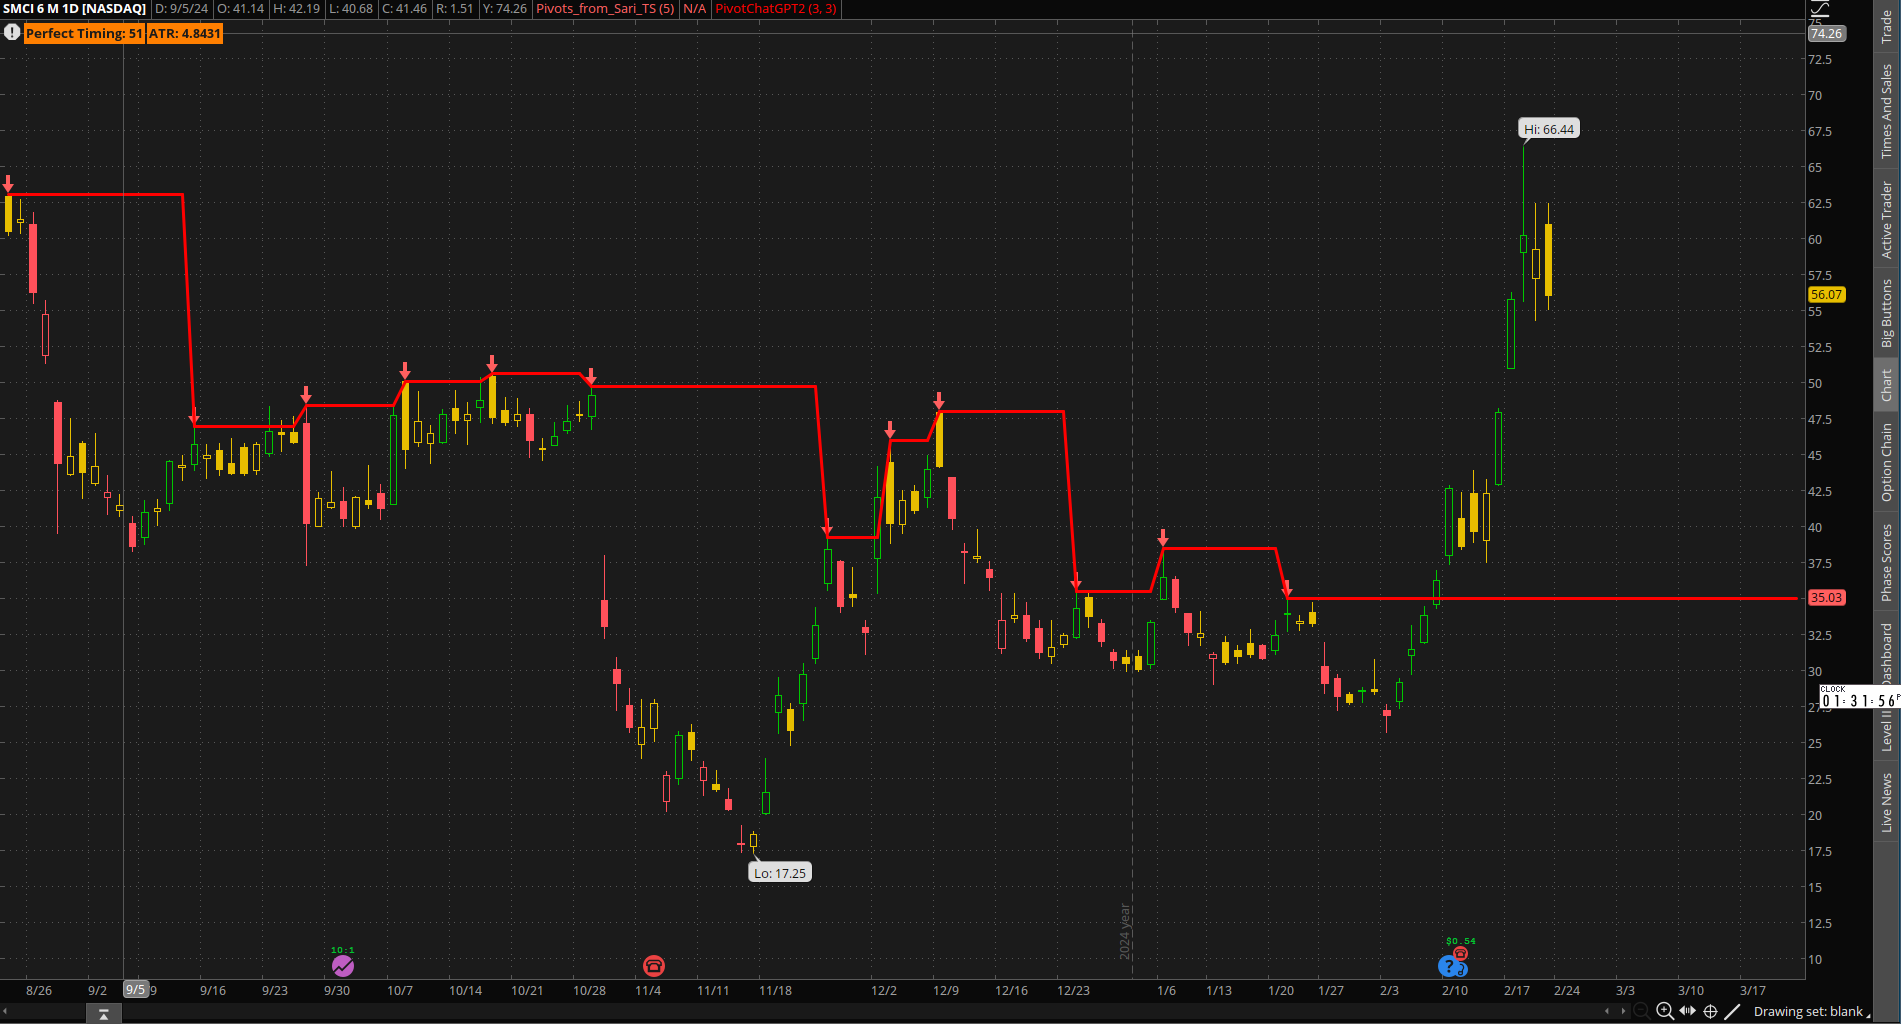
Here is the script that works: input Left = 3; # Number of bars to the left of the pivot def isPivotHigh = high > Highest(high[1], Left) and high >= Highest(high[-Right], Right); def currentBar = BarNumber(); # Capture the most recent trigger's bar number and high value # Capture the previous trigger's bar number and high value # Compare the highs from the last two triggers: def HighestHighPivot = Max(HP1High,HP2High); plot Result = HighestHighPivot; Attachments:
Marked as spam
Answered on February 23, 2025 12:47 pm
|
|||
|
Private answer
Since you are requesting a solution for a chart study I moved your question out of the Frequently Asked Questions topic and into the Chart Studies topic. I'm not sure this solution is going to do what you expect. But I believe that it does continue to track the highest of the last two swing high pivots. The only thing lacking is some sort of a rule which would allow this to reset the plot to a lower value as prices trend lower. I only get 15 minutes for each free solution I provide in this forum. And this is the most detailed solution I can provide within that time limit.
Marked as spam
Answered on February 22, 2025 3:58 pm
|