| ♥ 0 |
Hello. Does anyone know how to chart open interest * delta in real time, for options on the TOS platform, without using excel? Can it be done on your trading screen only? It seems we can chart OI and delta separately, but not combined. For instance (.”MSFT241018C400″)*delta()*openinterest;
Marked as spam
|
|
Private answer
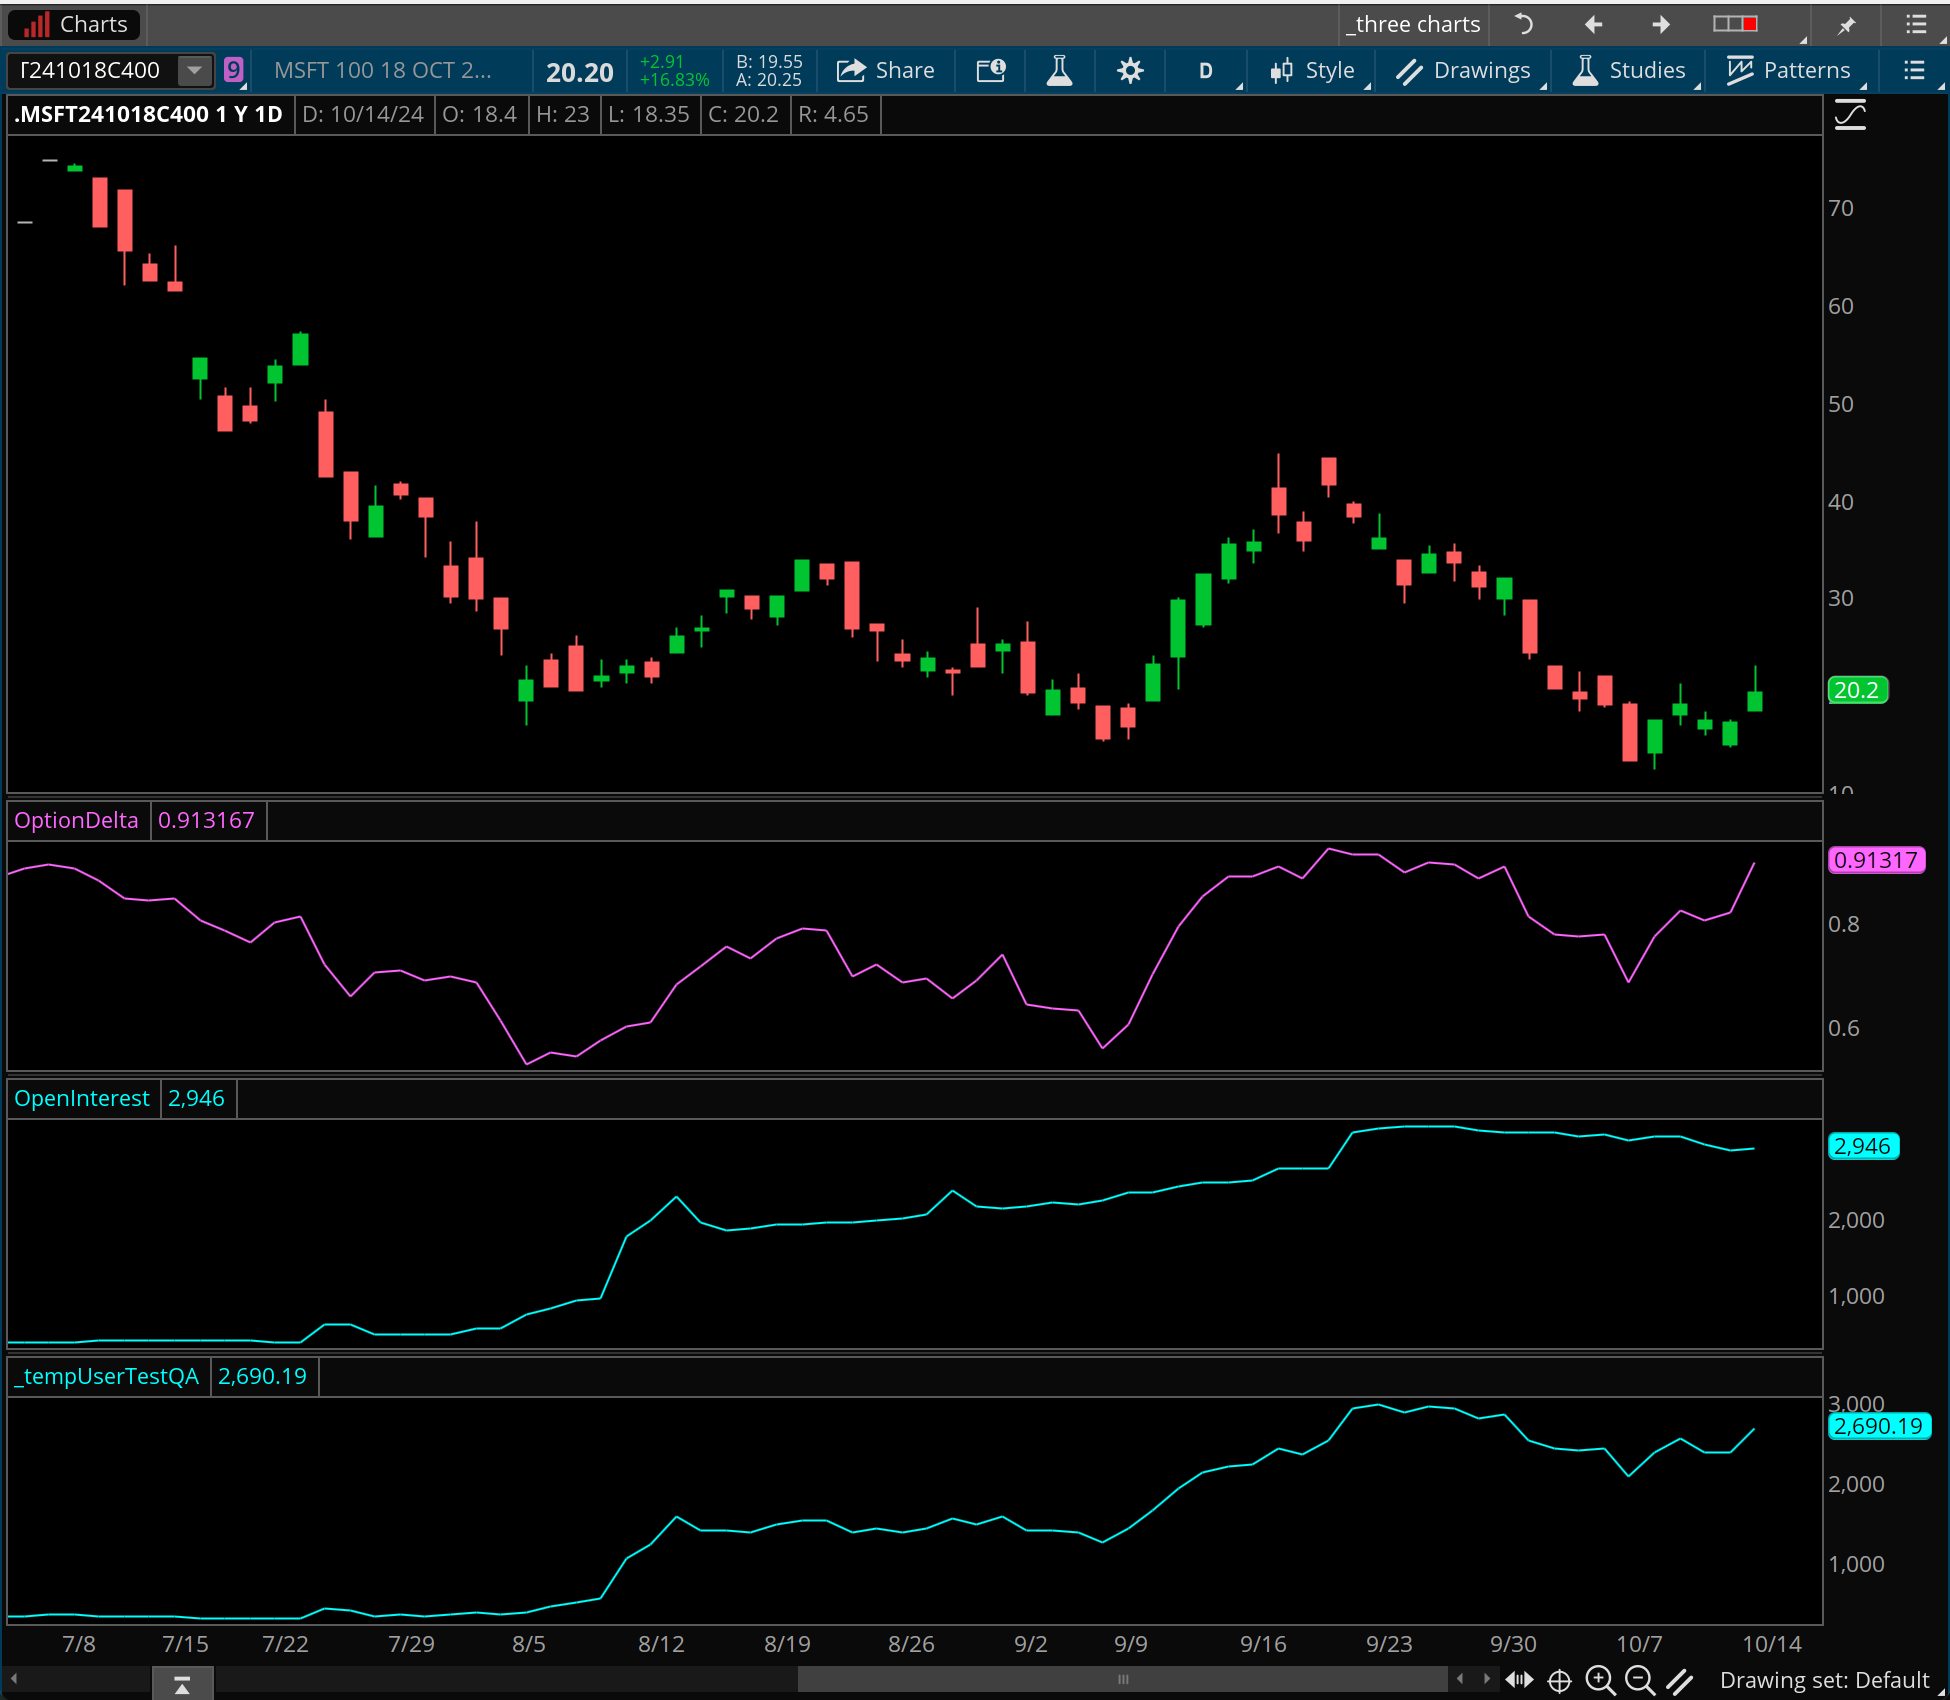
We can only do this on the daily time frame, because that is the only time frame from which the open interest is available. So we have to set the "period" parameter of the "open_interest()" function to the daily aggregation period. This allows us to plot this value on intraday charts. However the most accurate values will be computed on the daily chart. You can switch the time frame and check the values to see which ones work best for you. And the chart must be set to the specific option contract you want to track on the chart. Here is the script. Screenshot below shows the result, along with the other two data points so you can confirm the value is correct.
Attachments:
Marked as spam
Answered on October 14, 2024 1:37 pm
|