| ♥ 0 |
Good evening, I have been searching for hours for a workaround on the limited aggregation period for the TOS scanner. I am trying to create a scan that will return stocks with a tick count > 5000 over a 24 hour, Intraday period. As you probably know, tick_count() does not work with the Daily aggregation period, and the highest available Intraday aggregation period is 4 hours on the drop down in the scan configuration. I have been all over Google, with people pointing to ideas of possibly including multiple aggregation periods in the script, or defining start and end times, or possibly using some variable other than aggregation period to achieve the result. My thinkscript knowledge is limited, so I have been unable to build on any of that, but I was curious if your response to another question might be useful in this situation (https://www.hahn-tech.com/ans/how-do-i-get-a-count-of-the-number-of-ticks-bars-over-a-certain-time-period/). Tick_count() is easily achieved on the chart using a custom 24h/Intraday time frame and simple study, but that doesn’t help much in regards to scanning for stocks in that time frame.
Marked as spam
|
|
Private answer
The good news is that, if I understand your request, there is a solution. You simply want a scan that will measure the total number of "ticks" within each 24 hour session. And you want to be able to scan for a value which is greater than 5,000, total ticks. If that is correct, the following solution is exactly what you are seeking. The only detail that was not perfectly clear is whether you want to
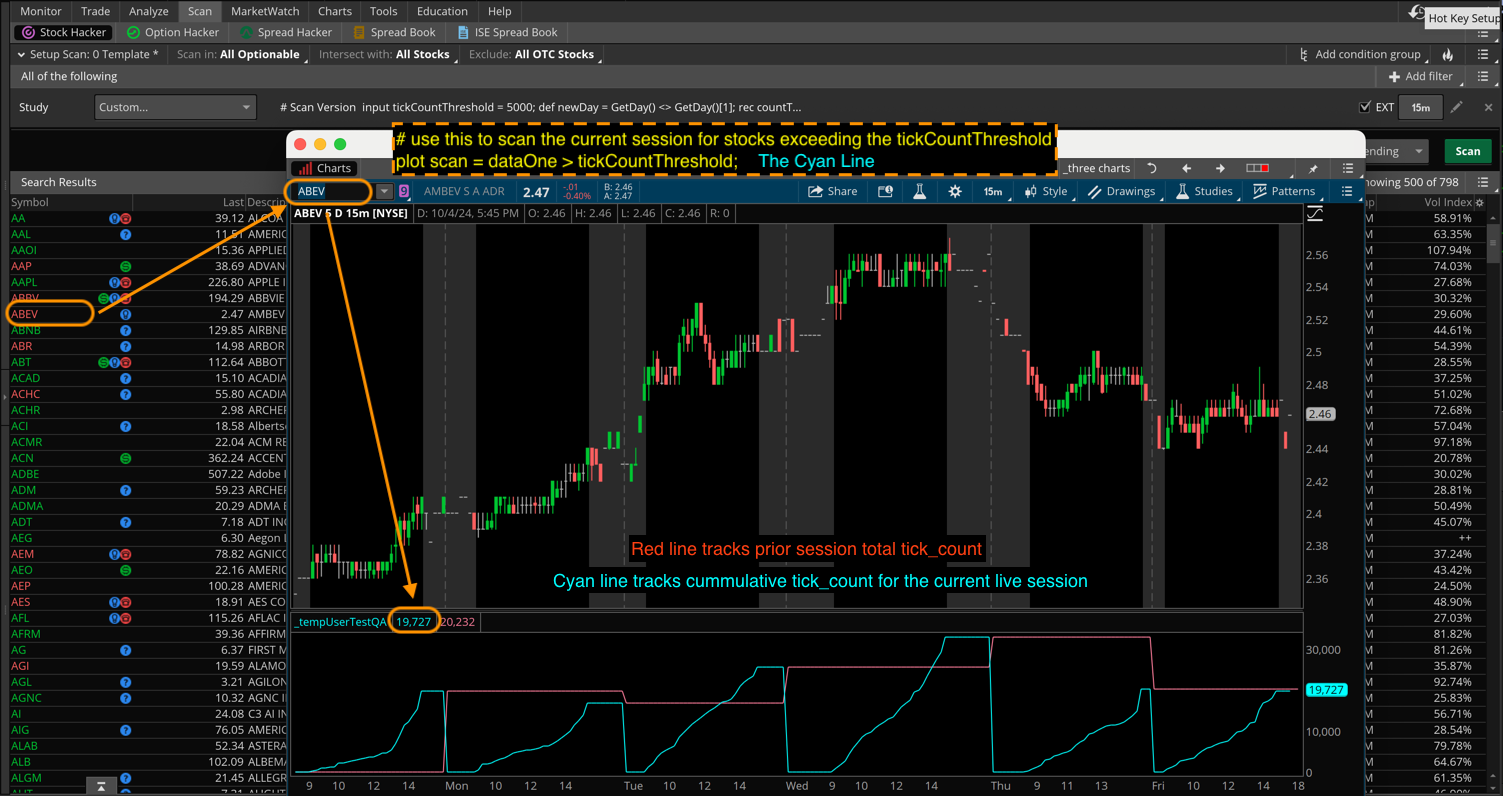
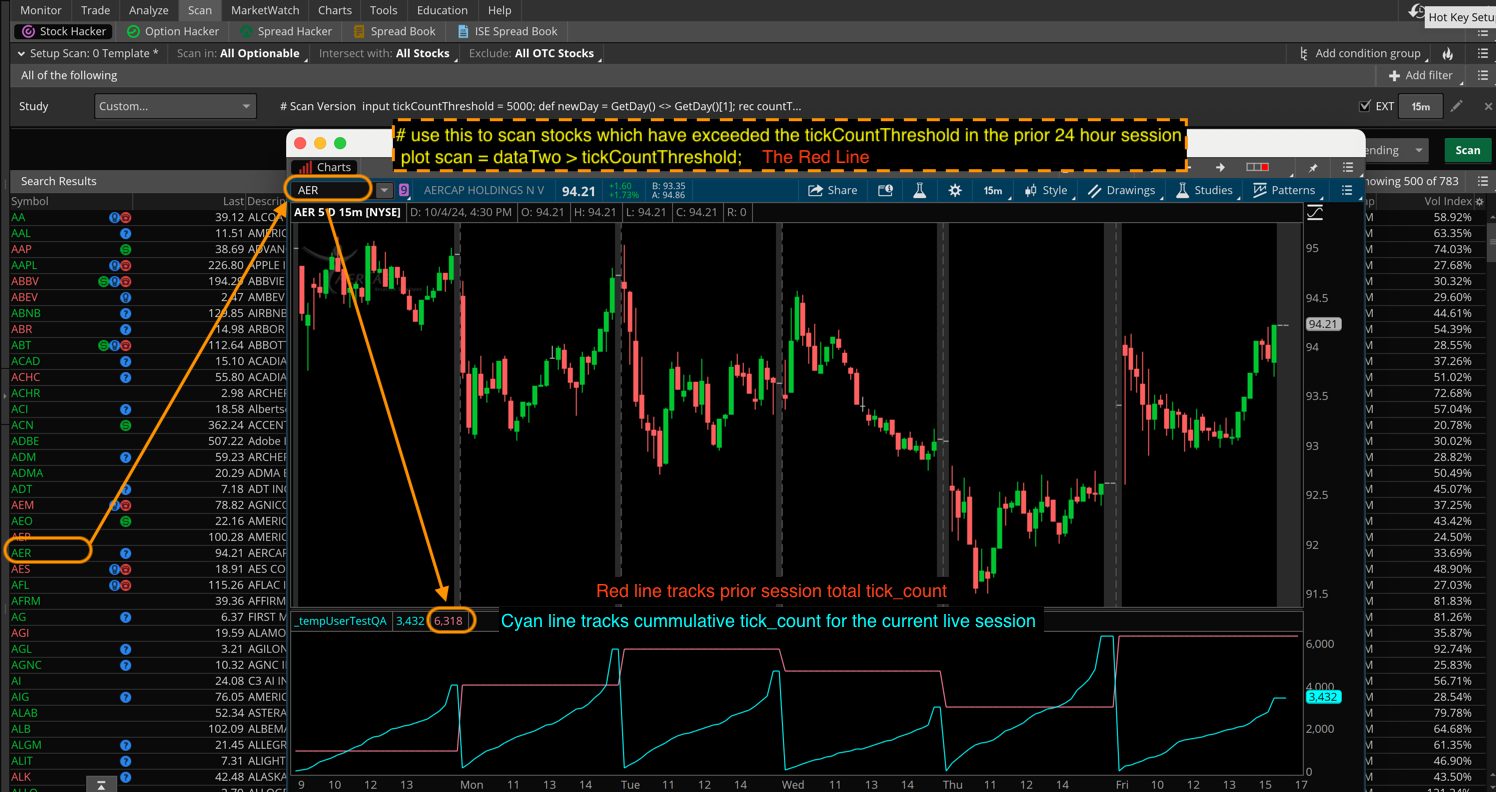
So I created a chart study and a scan which performs both. The chart study will show you exactly what the scan is measuring. The cyan line is the cumulative tick_count for the current live session. The red line is the complete tick_count for the entirety of the previous session. I also included a user input so you can change the tick_count threshold you want the scan to identify. Here is the script for the chart study:
And here is the script for the scan version:
Screenshots below show scan results for each of the options included in the scan. Each scan result includes an example chart set to one of the stocks in the results list. Comments and drawings have been added to demonstrate exactly what each scan option is identifying in the results list. I have a few comments to help everyone understand some of the limitations in Thinkorswim.
For those interested in further study. You can read about the tick_count() function here: https://toslc.thinkorswim.com/center/reference/thinkScript/Functions/Fundamentals/tick-count And if you want to know just about everything there is to know about using the Stock Hacker scan tool on Thinkorswim.... I suggest you view my Master Class video on this topic, located here: https://www.hahn-tech.com/thinkorswim-scans-beginner-to-advanced/ If you found this solution helpful and educational, please support my work by sharing this post with everyone you know. Attachments:
Marked as spam
Answered on October 4, 2024 5:05 pm
|